Business Intelligence

The Business Intelligence solution solves one of the main challenges of the Contact Center, converts the data generated in the Contact Center into useful information and business opportunities.
ASK FOR A PERSONALIZED DEMO
The results of implementing a BI tool in the contact center are:

360-degree view of the business and all processes.

Dynamic real-time reporting to access and interact with data quickly and intuitively.

Identifying behaviors, preferences, and trends to anticipate customer needs, increasing sales, satisfaction, and brand loyalty.

Transform the data generated in the contact center into business opportunities

Contact Centers generate and store a large volume of data, making it difficult to extract valuable information that can make a difference in both customer relations and operations.

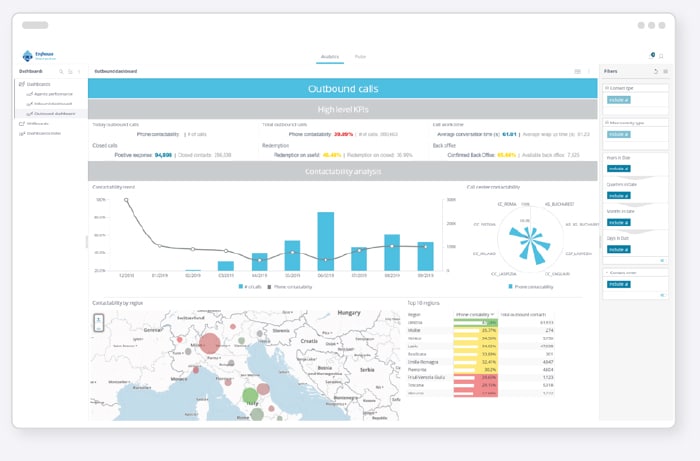
Enghouse Interactive’s Business Intelligence tool gathers all this information in an interactive and visual dashboard, which allows to know users and predict their behavior, facilitating decision making and increasing business opportunities.

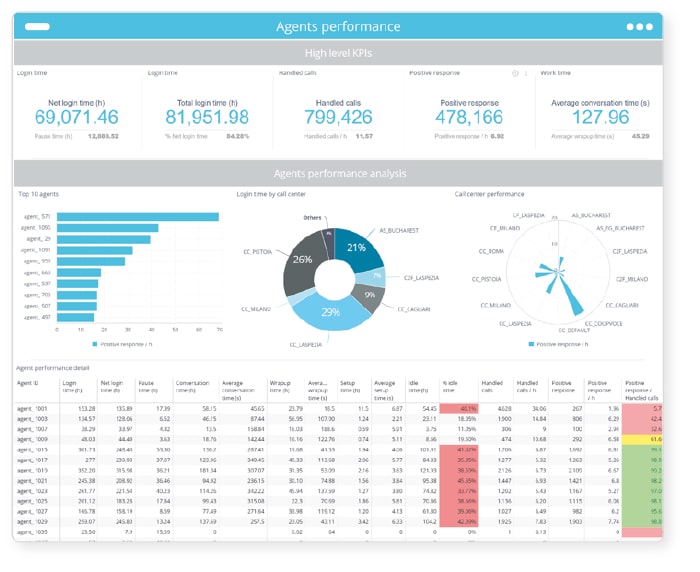
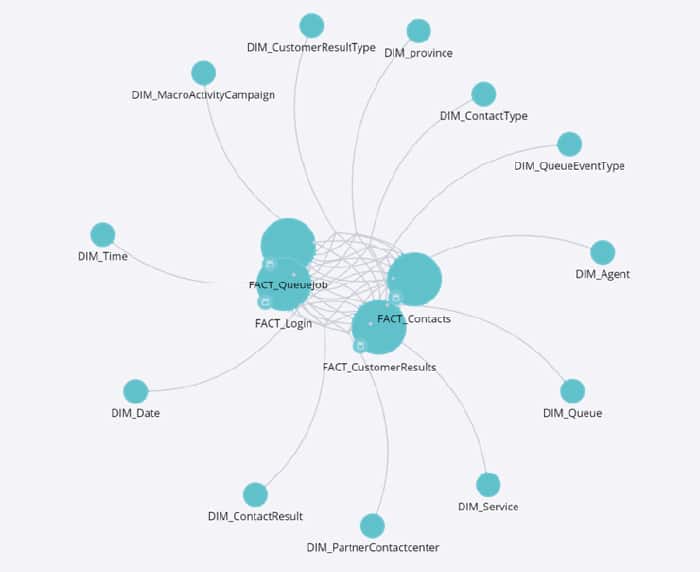
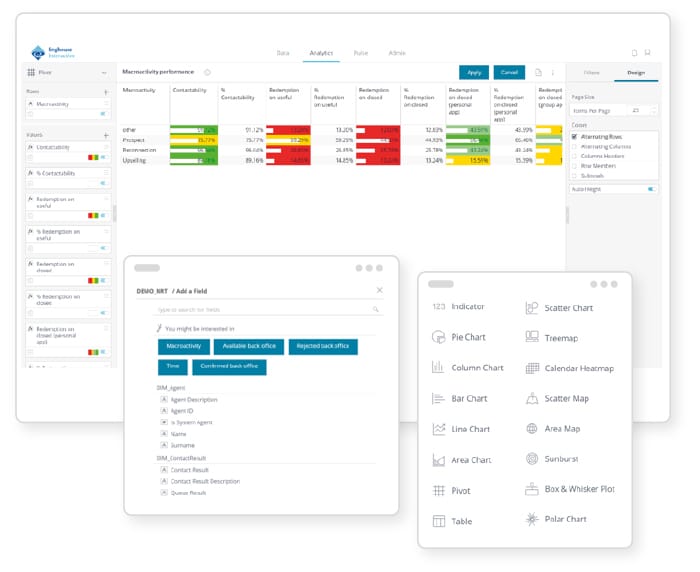
Drag & drop data models, combined with in-chip technology, allow immediate responses to queries. Navigate through the data collected by all Enghouse solutions, and present it in interactive dashboards that can be shared across the organization.

Benefits

  • It standardizes information about multi-product and multi-module EI installations.
  • Provides a valuable experience.
  • There is no need to know SQL or to involve the IT department.
  • Freedom of access to all the data details you need. Not limited by static reports.
  • The data export can be imported into other applications.
  • Control over monitoring.
  • Possibility to share dashboard and results with third parties, allowing collaboration.
  • It answers complex questions in seconds: “Sales trend by product in outbound campaigns over the past year by quarter, by calls made to cell phones, and by agent seniority.”

Why Enghouse BI?

Contact centers generate and store an extraordinary amount of data related to customers, agents, interactions and conversations. Enghouse BI, the new way to visualize and interact with data to get answers to complex questions, guiding you to the right decisions in seconds.

Analytic Data Model

  • Extremely fast representation.
  • Interactive widgets.
    • Filtration / Sizing
    • Desglose and Drill-back.
    • Change in sizing.
  • Pre-defined filters and bookmarks.
  • Data export in multiple formats: CSV, Image, PDF.
  • Easy collaboration between users. Easy to embed in any website.

Design

  • Extensive widget library.
  • No knowledge of SQL is required.
  • Customization of the control panel and widgets.
    • Distribution of objects, font, colors…
    • Filter options.
    • Relationship between widgets.
    • Conditional colors.
    • Data representation and its order.
    • Calculations or behaviors.
  • Export and import control panel.

Analysis

  • Extremely fast representation.
  • Interactive widgets.
    • Filtration / sizing.
    • Breakdown and Drill-back.
    • Size change.
  • Pre-selected favorite filters and bookmarks.
  • Data export in multiple formats: CSV, Image, PDF.
  • Easy collaboration between users.
  • Easy to embed in any website.

Monitoring

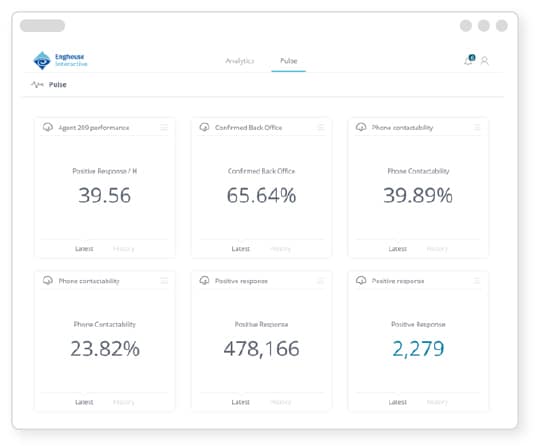
  • Monitoring KPIs and setting alarms.
  • KPIs monitored on dedicated screen:
    • Displays the last value.
    • Access to the previous values to identify trends
  • Alarms:
    • Operated by: limit, automatic, and always.
    • Notified by email or via webhook.
    • Ability to share notifications with other users.